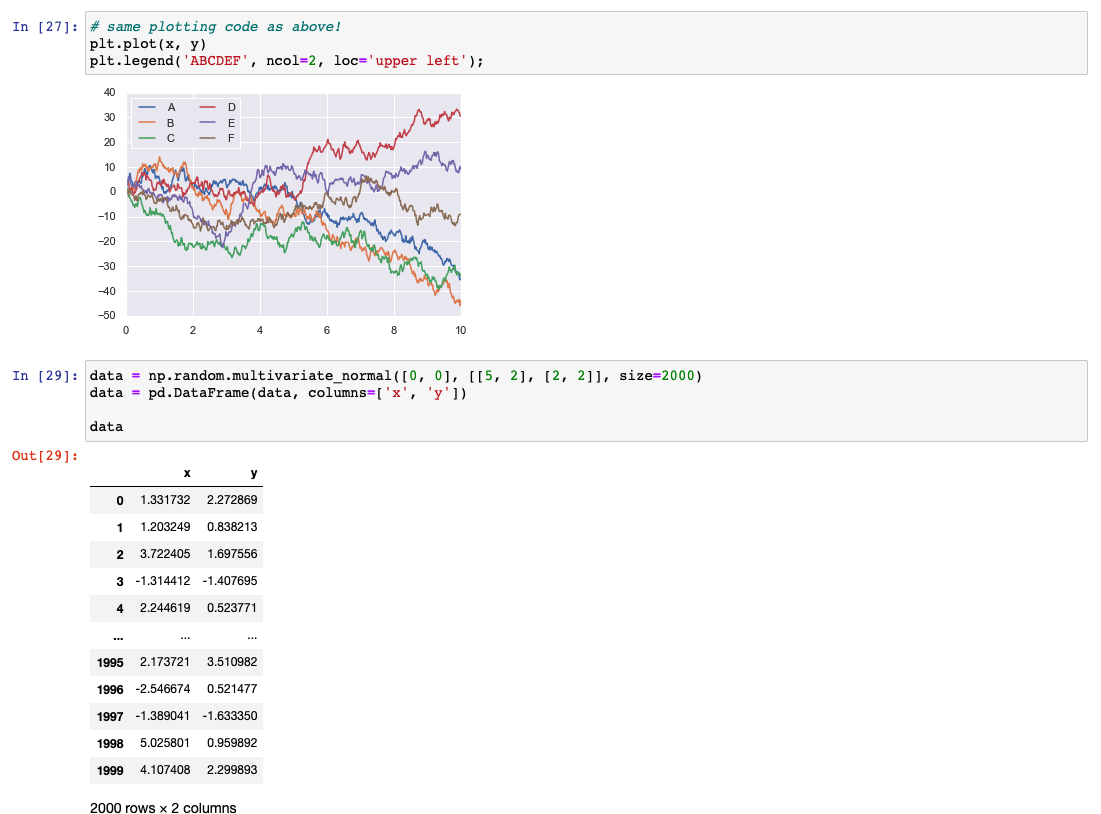
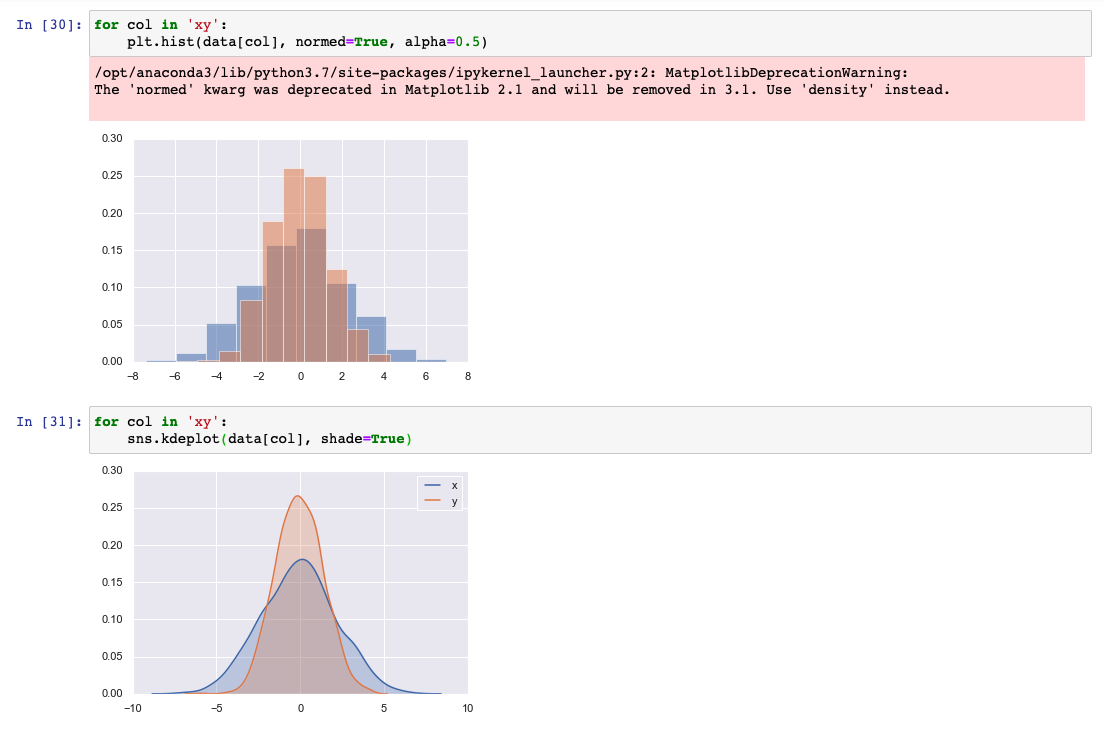
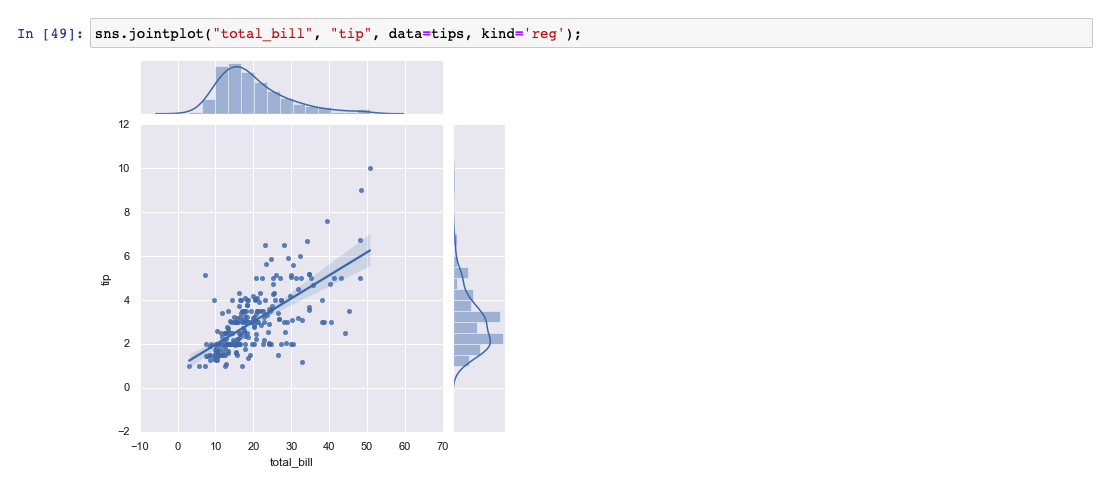
그래프를 몇가지 그려보겠습니다.


참조
[1] - https://jakevdp.github.io/PythonDataScienceHandbook/04.14-visualization-with-seaborn.html
'개발 > Kaggle' 카테고리의 다른 글
| Rossmann Store Sales - 2 (0) | 2020.03.31 |
|---|---|
| Rossmann Store Sales - 1 (0) | 2020.03.31 |
| heatmap (0) | 2020.03.31 |
| 시계열 데이터 (0) | 2020.03.25 |
| fb prophet (0) | 2020.03.25 |