https://www.kaggle.com/c/telstra-recruiting-network/data
Telstra Network Disruptions
Predict service faults on Australia's largest telecommunications network
www.kaggle.com
여기 들어가보면 아래와 같이 설명이 나옵니다.
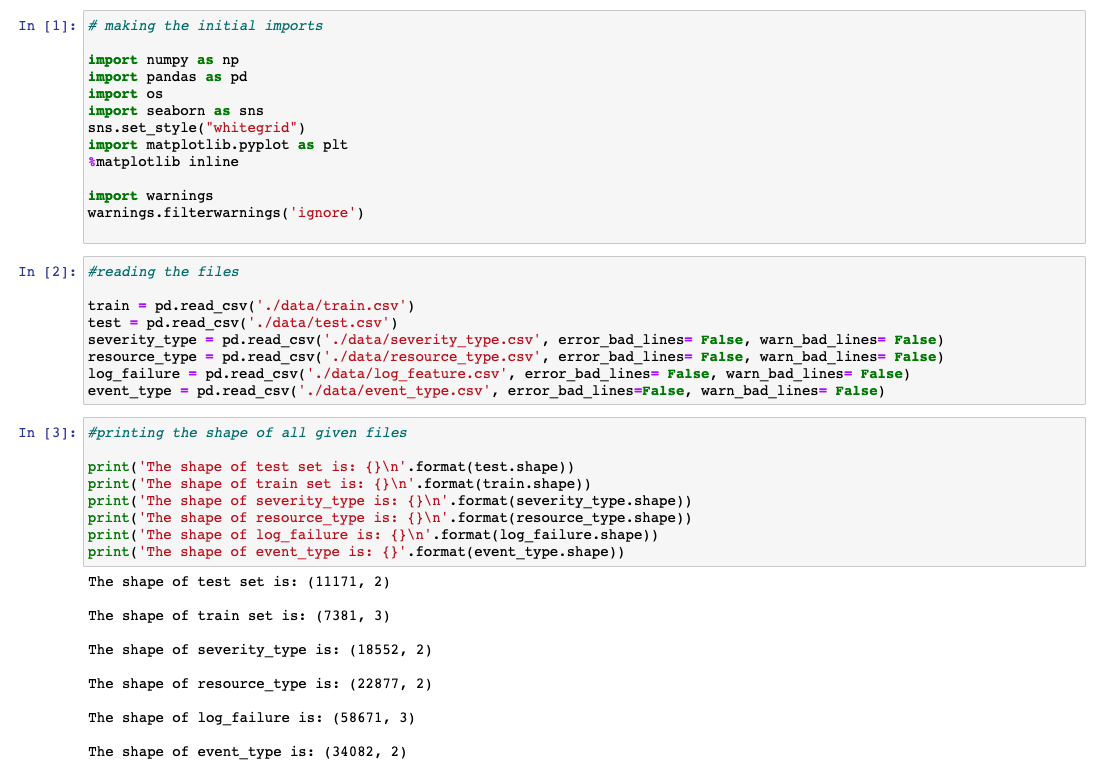
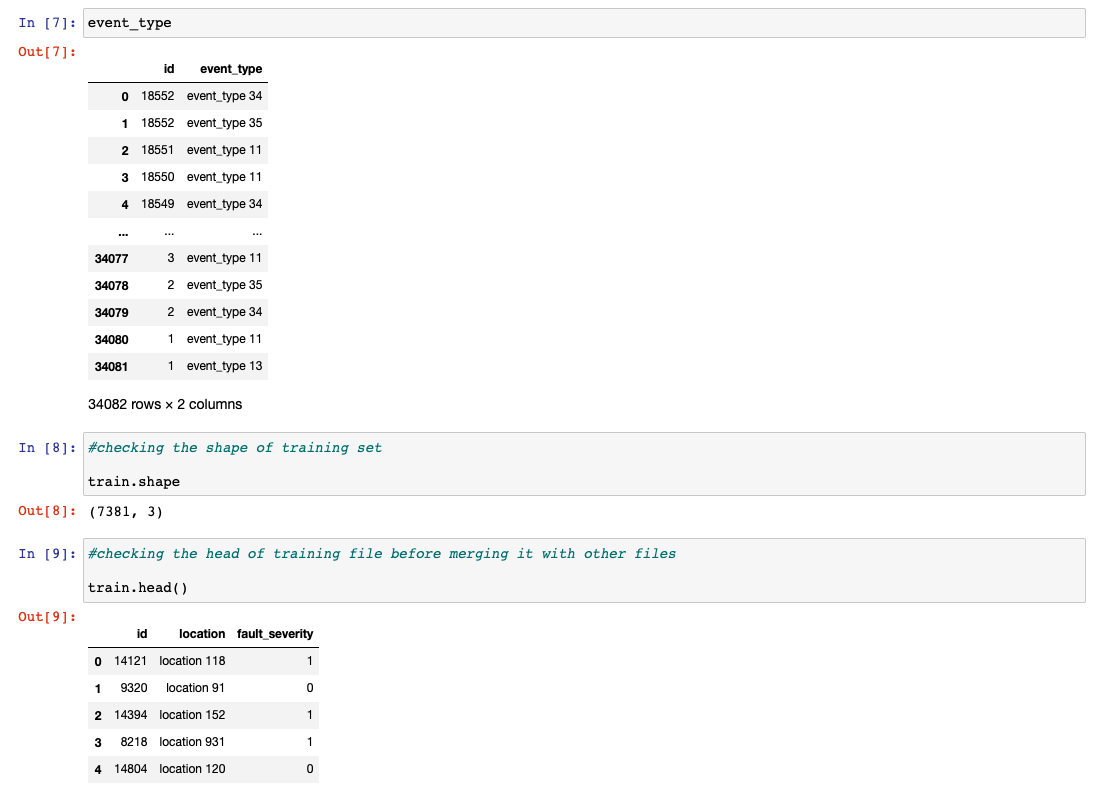
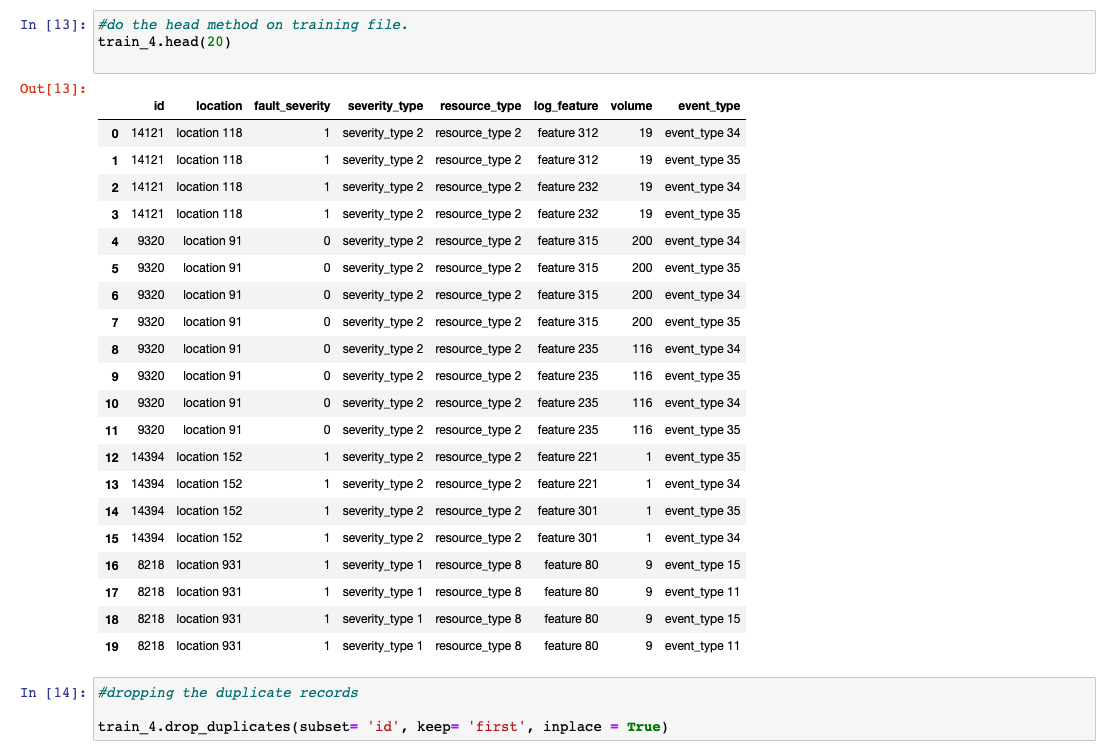
The goal of the problem is to predict Telstra network's fault severity at a time at a particular location based on the log data available. Each row in the main dataset (train.csv, test.csv) represents a location and a time point. They are identified by the "id" column, which is the key "id" used in other data files.
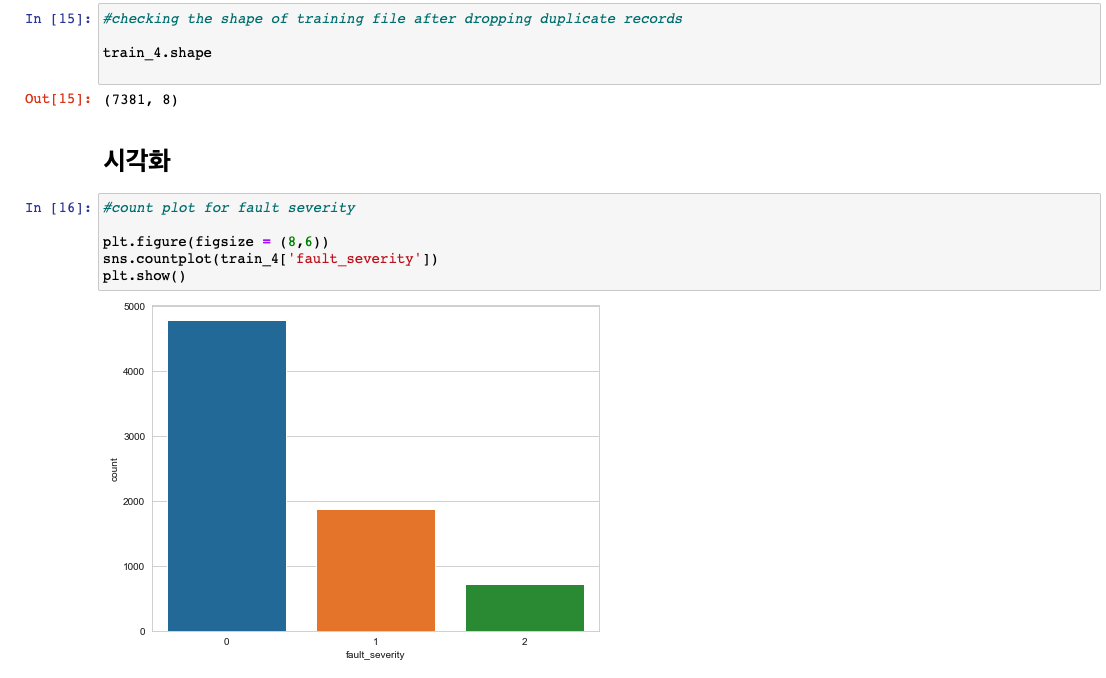
Fault severity has 3 categories: 0,1,2 (0 meaning no fault, 1 meaning only a few, and 2 meaning many).
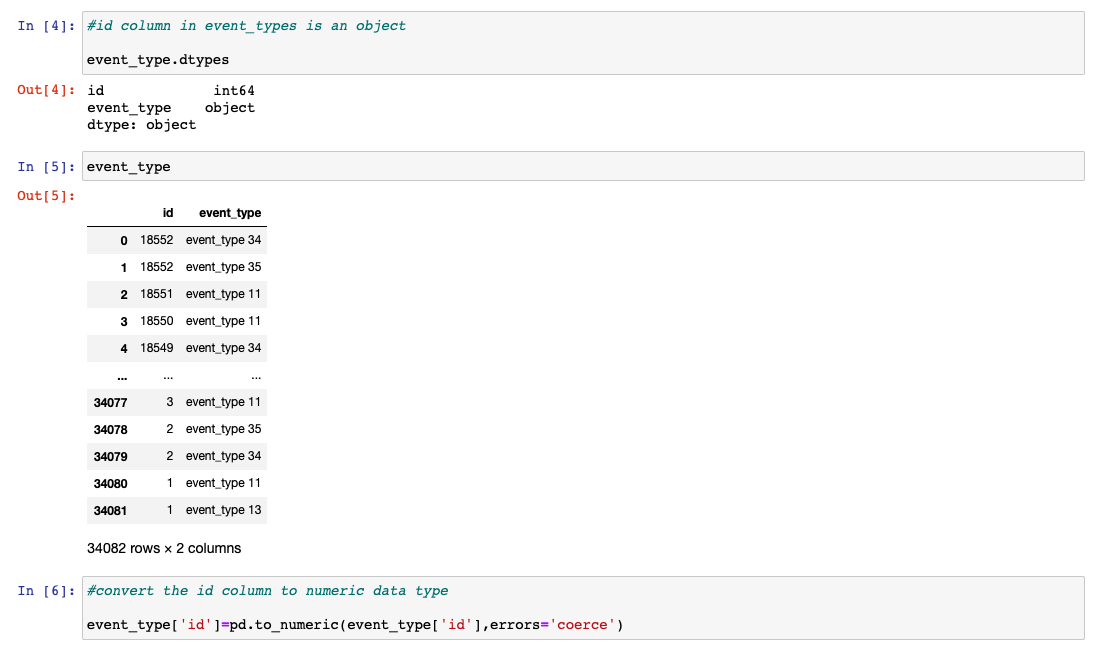
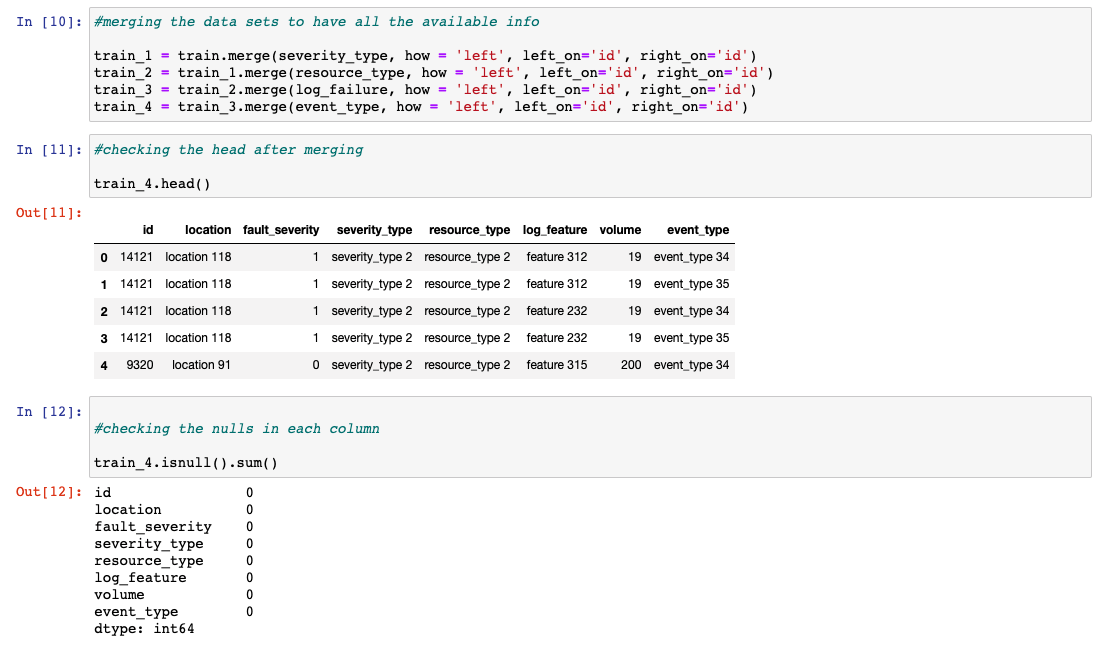
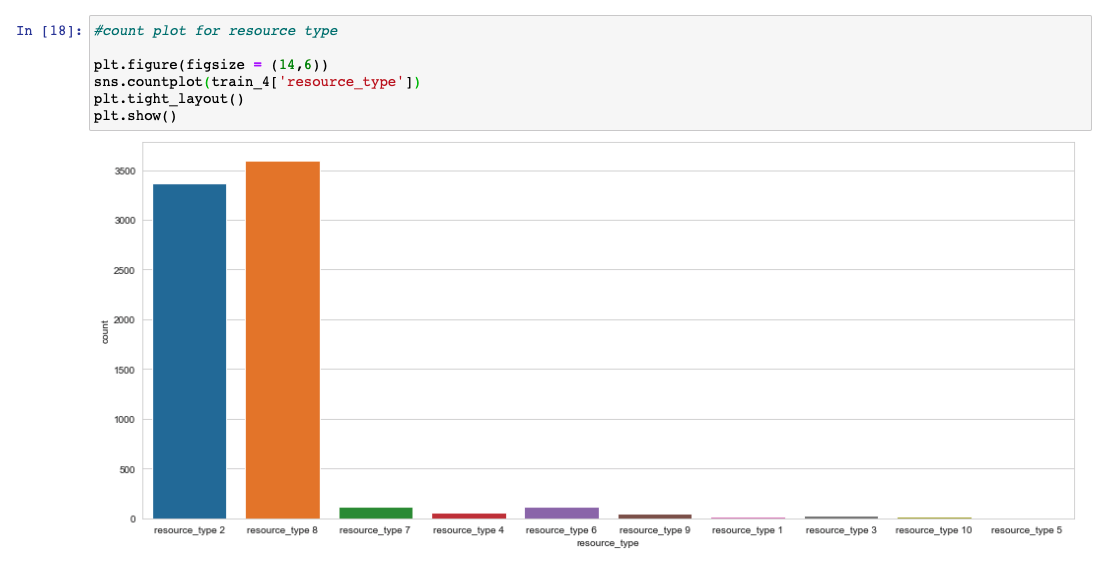
Different types of features are extracted from log files and other sources: event_type.csv, log_feature.csv, resource_type.csv, severity_type.csv.
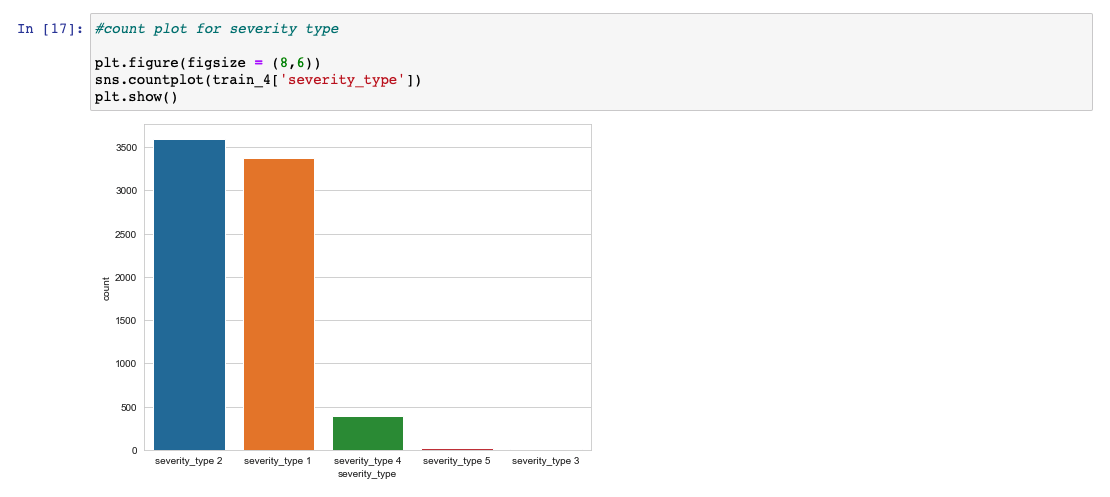
Note: “severity_type” is a feature extracted from the log files (in severity_type.csv). Often this is a severity type of a warning message coming from the log. "severity_type" is categorical. It does not have an ordering. “fault_severity” is a measurement of actual reported faults from users of the network and is the target variable (in train.csv).
이게 뭔지 한번 보면 Telstra라는 통신 회사가 있는 것 같은데, 얘네들이 지역에 따라 네트워크 결함을 예측하고 싶어하는 것으로 보입니다.
0 은 결함없음
1 은 결함
2 은 결함 많음
정도를 알고 데이터를 한번 보고 가공해보겠습니다.
'개발 > Kaggle' 카테고리의 다른 글
| Telstra Network Disruptions - 2 (0) | 2020.04.12 |
|---|---|
| catboost (1) | 2020.04.10 |
| Rossmann Store Sales - 2 (0) | 2020.03.31 |
| Rossmann Store Sales - 1 (0) | 2020.03.31 |
| heatmap (0) | 2020.03.31 |